Saturday, January 24, 2015

I'll be saying goodbye to the 3rd Quarter. And I am now ready to face the Last Quarter and again, make my brain more awesome by learning more stuff about technology. :)


I hope you learned a lot from my blog and I wish you'll be able to apply these techniques in MS Excel.


 Ciao! :D


Image Source: https://images.search.yahoo.com

Macro

What is a Macro?
When is it used?
What is it for?
How do you do it?

A macro is a symbol, name, or key that represents a list of commands, actions, or keystrokes. Many programs allow you to create macros so that you can enter a single character or word to perform a whole series of actions.


Can you believe that you can be able to create a game because of Macros? The game, Minesweeper has macros applied to it. Yes, that's how powerful Macro is. And that's how efficient MS Excel is. Now, you know. :)

Minesweeper


Reference: http://www.webopedia.com/TERM/M/macro.html
              http://en.wikipedia.org/wiki/Macro_%28computer_science%29
Image Source: https://images.search.yahoo.com
                    http://gifsoup.com/view/4486833/minesweeper.html

Types of Charts

I want to enumerate some kinds of charts that can be used in Excel so you will be able to know what type of chart to insert at instances.


First is the Column Chart.

It is useful for showing data changes over a period of time or for illustrating comparisons among items.

There are two types namely the Clustered Column Chart and the Stacked Column Chart.


Second is the Line Chart.

it displays continuous data overtime, sets against a common scale, and is therefore ideal for showing trends in data at equal intervals.

Line-With-Markers. This is the default Line Chart. But other options also include Stacked Line.


Third is the Pie Chart.

It shows the size of items in one data series, proportional to the sum of the items. The data points in a pie chart are displayed as a percentage of the whole pie.


Fourth is the Bar Chart.

It illustrates comparisons among
individual items. It is advisable to be used when the axis labels are long and the values that are shown are durations.


Fifth is the Area Chart.

It emphasizes the magnitude of change over time, and can be used to draw attention to the total value across a trend.


Reference: http://peltiertech.com/Excel/ChartsHowTo/ChartType.html
                  http://moodle.pshs-brc.edu.ph/pluginfile.php/4913/mod_resource/content/0/Charts.pdf
Image Source: https://images.search.yahoo.com


Data Representation

 
 Can you insert charts and graphs in MS Excel?

Yes, you surely can!

If you think that you can only enter the data in the cells and do nothing else to make it more presentable, you are wrong.

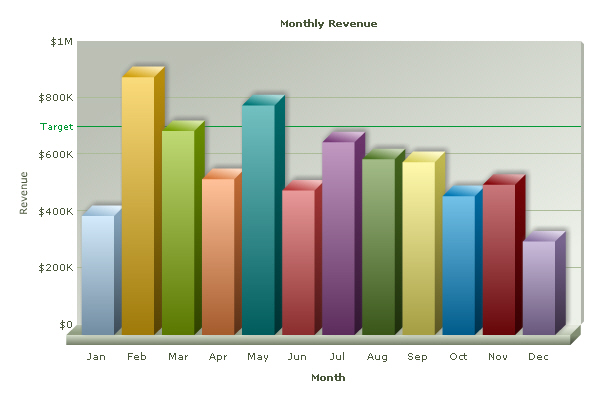
There are different ways to display data. Aside from just inputting the data into the cells, you can also express it in charts and graphs.

For example, if you are trying to communicate relations, such as how displacement changes with respect to force, it would be better if you will use a graph

These graphs and charts are more visual (qualitative). So if you hate numbers that much, try to use these, at least there would be some graphics in the sheet. :D


Reference: http://faculty.up.edu/lulay/MEStudentPage/graphexamples-how-to-do.pdf
Image Source: https://images.search.yahoo.com

Conditional Formatting


What is the use of conditional formatting?


Adding conditional formatting to a cell in Excel allows you to apply different formatting options, such as color, when the data in that cell meets the conditions that you have set.


                                           Where can we apply conditional formatting?

The use of conditional formatting is very efficient.
We can apply conditional formatting for the dates, for duplicating data and for values that are above or below the average value in a range of cells.


Reference: http://spreadsheets.about.com
Image Source: https://images.search.yahoo.com

IF Function


What is the IF Function for?
This returns one value if a condition you specify evaluates to TRUE, and another value if that condition evaluates to FALSE.


                                                           Reference:http://moodle.pshs-brc.edu.ph/pluginfile.php4818/mod_resource/content/0/IF.pdf 
                                                           Image Source:https://images.search.yahoo.com


   This was the activity I did applying the IF Function:

Logical Operations


First, let us define logic and operation.
Logic is the branch of philosophy that analyzes inference.
And Operation means data processing in which the result is completely specified by a rule.
So when we say logical operation in the branch of Computer Science, it is defined as an operation that follows the rules of symbolic logic.
 

http://excelsemipro.com/wp-content/uploads/2010/12/Logical-Operations-Add-Multiply-And-Or.png

The logical data type represents true or false states.
These logical operations are used to execute conditional codes.


 References: http://www.thefreedictionary.com
                     http://www.mathworks.com
Image Source: https://images.search.yahoo.com
When you hear the word, Microsoft Excel, what pops into your mind?

Numbers? Formulas? Functions?

Well, let us dig deeper into these words.


The numbers. Of course you are very familiar with them. These are often seen in the data you input at the worksheets.
But these are not only for that, the numbers can also be used in creating formulas.


The formulas. These are expressions used to perform calculations. Formulas begin with an equal ( = ) sign and are composed of operands and operators. You may also see constants, cell references, ranges, and grouping symbols within formulas.


The functions. These are predefined formulas that may require arguments as inputs. These may be used together with other functions and operations.


Oh and by the way, watch out for errors.

These are the common ones:

 
####
When you see this, expand the cell. This indicates that the data to be displayed is too long for the cell to display.

#N/A 
Recheck the data when you see this. This means that there is some data missing or there is no match for the function/formula you entered.

#REF! 
Be sure that the cell position you entered is correct. This error means that the cell reference is invalid.


Reference: http://moodle.pshs-brc.edu.ph/pluginfile.php/4746/mod_resource/content/0/Functions%20and%20Formula.pdf
Image Source: https://images.search.yahoo.com

Friday, January 23, 2015

Before I start sharing my knowledge, I want you first to familiarize yourself on the terms used in the world of MS Excel. So here I am to elaborate them.


#1  WORKSHEET
It consists of the cells. This is the page you work on.

#2  WORKBOOK
This is an excel file containing one or more worksheets.

#3  CELL
This is where you type the data or formulas.
The cells are arranged in numbered rows and lettered columns.

#4  NAME BOX 
This holds the reference number/position of the selected cell.


#5  COLUMN/ROW HEADING
This is used to identify a cell's position on the worksheet.


Now that you know the basic terms, I will start imparting to you the things Microsoft Excel is capable of doing.


Reference: http://moodle.pshs-brc.edu.ph/pluginfile.php/4705/mod_resource/content/0/Spreadsheet%20for%20Data%20Analysis.pdf

Image Source:  https://images.search.yahoo.com

A New Quarter

3rd Quarter


New quarter. New topics. New learnings.
Now that I'm back, I'll be glad to impart to you a new ton of awesome discoveries.

It was very cool to know that Microsoft Excel isn't just for solving our grades and inputting those numbers.
It can do a whole lot more!

https://sp.yimg.com/ib/th?id=HN.608031403770056165&pid=15.1&P=0

From creating formulas to applying rules and macros, I'm here to enthusiastically share the things Sir Tom have taught us.