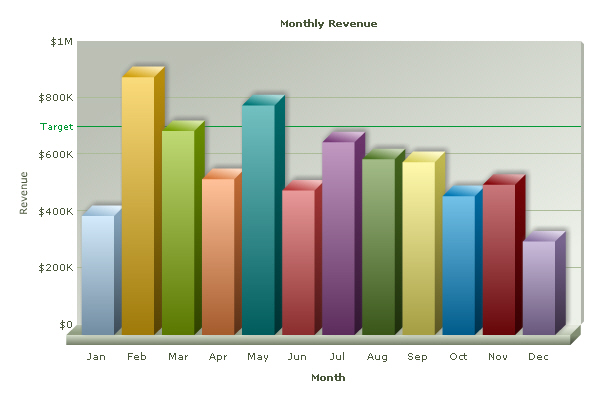
First is the Column Chart.
It is useful for showing data changes over a period of time or for illustrating comparisons among items.
There are two types namely the Clustered Column Chart and the Stacked Column Chart.
 Second is the Line Chart.
it displays continuous data overtime, sets against a common scale, and is therefore ideal for showing trends in data at equal intervals.
Line-With-Markers. This is the default Line Chart. But other options also include Stacked Line.

Third is the Pie Chart.
It shows the size of items in one data series, proportional to the sum of the items. The data points in a pie chart are displayed as a percentage of the whole pie.

Fourth is the Bar Chart.
It illustrates comparisons among
individual items. It is advisable to be used when the axis labels are long and the values that are shown are durations.

Fifth is the Area Chart.
Reference: http://peltiertech.com/Excel/ChartsHowTo/ChartType.html
http://moodle.pshs-brc.edu.ph/pluginfile.php/4913/mod_resource/content/0/Charts.pdf
Image Source: https://images.search.yahoo.com
No comments:
Post a Comment